SPACE WEATHER: TIMELY SYNOPTIC MODELLING of the
NORTHERN E and D REGION ELECTRODYNAMICS and HEATING
J. K. Walker, P. Stauning, and 0. Troshichev
88 Starwood Rd., Nepean, ON, Canada
Danish Met. Inst., Copenhagen, Denmark
Arctic & Antarctic Res. Inst., St. Petersburg, Russia
INTRODUCTION
During
the past few decades magnetic or space storms and related geospace storms have
caused an increasing number of major disruptions of important power and
communication services, malfunctions and loss of expensive facilities and
satellites, and degradation of numerous geophysical surveys (Bames and Van
Dyke, 1990). The next solar maximum is expected
in a few years and the risk will again be high.
Real-time modeling and improved forecasting of geospace activity are
urgently needed to mitigate the effects of magnetic storms on sensitive
industrial facilities, satellites, and radio transmissions and on geophysical
surveys.
Accurate
forecasting of the dynamic magnetic and geospace activity is exceptionally
difficult. However, now casting may be
possible with (1) L1 (WIND, ACE and SOHO) real-time solar wind observations,
(2) in situ magnetospheric observations such as GOES, LANL, POES, GPS, THEMIS and CASSIOPE data
and (3) key parameters mapped from real time electrodynamic models of the high
latitude E region ionosphere. Most
geospace activity leaves a footprint on the ionosphere. Hence the first step in space weather
modeling and now casting is the determination of timely and sound modeling of
the high latitude D and E region electrodynamics and heating. Such ionospheric and electrodynamic modeling
requires, of course, extensive observations of the dynamic D and E region
ionospheres in addition to numerous ground-based magnetic observations. From such ionospheric, magnetic and auroral
observations models of the ionosphere and its conductances, the electric
fields, the ionospheric and field-aligned currents and the Joule heating of the
upper atmosphere can be determined and the thermospheric winds estimated. The very energetic precipitating particle
flux and related heating in the D region can also be estimated.
The E
region parameters are crucial for understanding its electrodynamics and timely
models of critical ones can be mapped to the magnetosphere, and with the in
situ satellite observations, help provide an indication of its present state
for now casting. The magnetic Kp and
other indices, which are presently used, do not provide adequate spatial and
temporal information about the activity in the ionosphere or that within the
magnetosphere. The heating and
electrodynamics are also important for understanding the high latitude
thermosphere and some associated mesospheric disturbances. This note addresses this important link,
namely timely synoptic modeling of the ionosphere E and D regions from several
different observational platforms for improved spatial and temporal resolution
of the layer. Hence more accurate
determination of (1) the ionospheric electrodynamics, (2) upper atmospheric
heating and (3) related magnetospheric parameters then become possible for now
casting of the geospace activity. The
timely models are also important for mitigating storm effects on power lines,
communication lines, pipelines and on geophysical surveys.
Magnetic
storms and polar cap absorption/solar proton events (PCA/SPE) subject high
altitude spacecraft to very energetic particles that cause charging and other
effects on satellites (Wadham, 1987-1; Lam and Hruska, 1991; Baker et al., 1994
and see Aerospace study). Such events can lead to the
failure of components and satellite systems.
The storms also inflame the upper atmosphere so much that it
significantly perturbs the stability and reduces the lifetime of low altitude
satellites. Major storms also heat the
mesosphere (Walker and Bhatnagar, 1989) and, during the winter, may alter its
composition (Callis and Natarajan, 1986) and perturb the circulation of the
polar vortex. However, four extended periods
of solar inactivity during the 1000-1700 AD period were coincident with mini
ice ages. The associated disturbances in
the ionosphere are the bane of high latitude HF and some satellite radio
communication and distant surveillance systems.
The enhanced high latitude radiation during storms is also of concern to
the new commercial transpolar aircraft flights as the increased exposure can
significantly affect passenger and crew safety.
The storms disrupt expensive high latitude magnetic surveys and directional
drilling, while unsettled conditions significantly degrade the surveys. Storm-induced telluric currents feed into
long power lines and can destabilize and sometimes disrupt the power
distribution system (Boteler, 1991) and destroy expensive equipment. Hydro Quebec, following a 9 hr outage in
March 1989, has installed several expensive (a few billion dollars) series
capacitors in most of its long power lines to mitigate such problems and
associated outages. However, other
utilities do not have such protection and hence are vulnerable to storm induced
currents. Super
storms are expected to cause induced currents and other disturbances in the
lower latitudes such as the U.S. and in southern Europe. The associated large ionospheric and induced
currents in these regions will probably cause numerous outages which may extend
for some time as the transformers are difficult to replace. The telluric
currents can also overwhelm the cathodic (corrosion) protection systems on
pipelines as well as disrupt pipeline potential surveys (Boteler, 1992). The
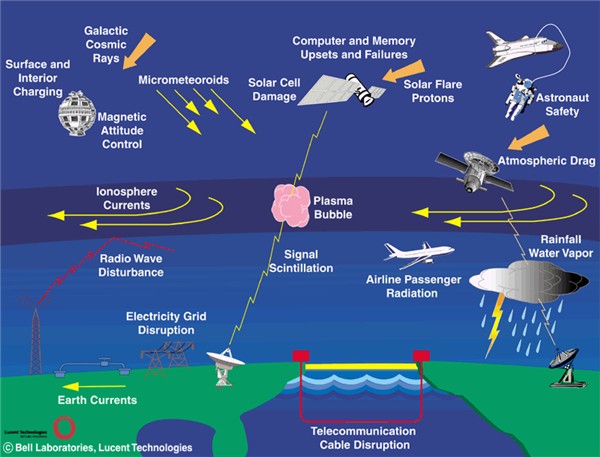
following Bell Labs diagram depicts some of these relations. An electromagnetic pulse (EMP) from a nuclear
explosion a few hundred kilometers above the earth can induce large currents in
power and communication lines that can destroy significant equipment and
thereby disrupt or degrade the power and communications services to a large community
(Kramer,
2009).
Real-time
models and now castings with maps showing the magnetic field disturbances,
ionospheric and induced currents and the ionospheric and geospace activity are
urgently needed by operators and surveyors to mitigate the effects of magnetic
storms on their equipment and on their surveys.
Aircraft crews need to be fully aware of radiation from storms so that
they can lower their planes altitude to mitigate the effects on passengers and
crew. Numerous geospace experiments,
such as those from sounding rockets, balloon, active spacecraft and
ground-based facilities, often require such timely information with maps and
models showing the ionospheric activity and its associated electrodynamics for
optimum observations.
TIMELY
MODELLING OF THE MAGNETIC and GEOSPACE ACTIVITY
Some
real-time observations are becoming available from several networks and
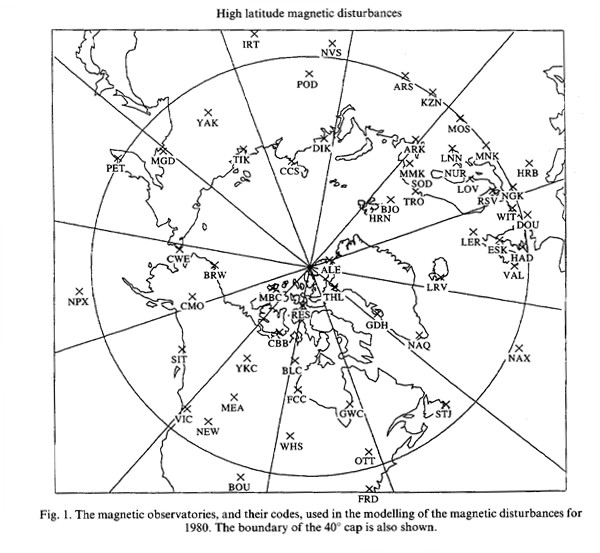
facilities and possibly some from INTERMAGNET. Walker developed a
facility for synoptic modeling of the magnetic disturbances and the associated
ionospheric and induced equivalent currents over Canada (Walker, 1989) and the
northern high latitude region (
Walker et al., 1997). The 55 magnetic observatories
and the cap, which is centered on the eccentric dipole and used for the
spherical cap harmonic analysis, are shown on the following map.
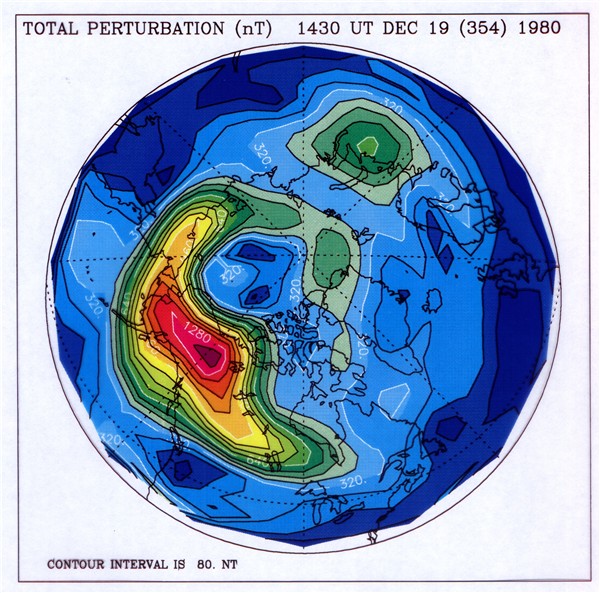
The
hourly magnetic observations for 1980 were used to model the vector and total
magnetic disturbance over the whole cap and also the ionospheric and induced
currents. The total magnetic field
disturbance for a storm on Dec 19th is nearly 1400 nT over Alaska
and the Yukon and the ionospheric currents at this time were over 2 A/m. Such timely maps are of interest to those
during geophysical surveys so they can optimize their observing period and
later possibly correct some of the data with values calculated from such
models. The compass deviation can be
several degrees in high latitudes during storms and maps showing such variations
can also be calculated. These deviations
are of interest to navigators and crews who are using magnetic sensors for
directional drilling.
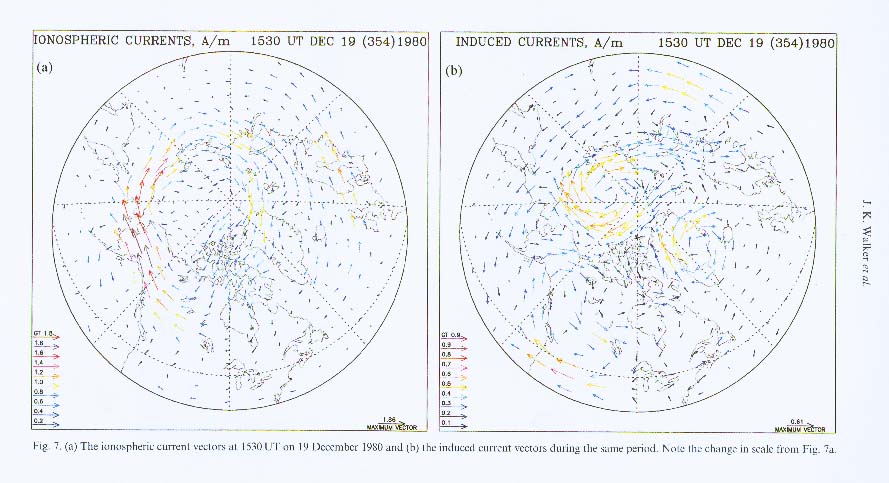
The
arrows on the map below show the direction and magnitude of the ionospheric and
induced currents one hour later when the storm had moved over Siberia. The ionospheric currents show where the
action is in space while the induced currents are of interest to operators of
power lines, communication lines and pipelines. The maximum induced currents will flow into
such grounded utilities when they are aligned with the pipeline or power line.
Walker
also developed and tested in 1996 for over 2 years a method for timely modeling
of the magnetic activity using real-time magnetic observatory data while a
volunteer sometime ago at the GSC.
However, support was very limited and indeed oppressive and working
conditions were also poor. It is
important that this or some other real-time facility be made operational so
that industry can see the extent of the activity on the maps and optimize their
operations vis-à-vis the regions and periods of storms and substorms. The first expansion phase of this modeling
should be to extend it over the northern USA, Alaska and eastern Siberia with
the additional real-time data presently relayed by GOES West and GMS. The modeling should also be extended eastward
first over Greenland with data relayed by GOES East, and then over northern
Europe and eventually northern Russia with timely (<12 min.) data relayed by
METOSAT. The activity seemingly moves
westward with the rotation of the earth so such data and real-time maps from
the models can provide an indication of approaching activity.
The
present distribution of magnetic observatories in the high latitude regions is
very sparse and more are needed to provide adequate coverage for the
delineation of substorms and for better real-time (half-hour) modeling. About 80 well-distributed observatories would
be needed for such detailed modeling. It
is suggested that a program be initiated to significantly improve the coverage
in the high latitude Northern Hemisphere.
A second study of the high latitude Southern Hemisphere should also be
made but with the objective of about 40 observatories for only basic coverage
(hourly models). Note the quiet
nighttime undisturbed level (Walker, 1982) should be used for the reference for
accurate modeling of the disturbances and separation of the external and
internal current sources. Furthermore,
only magnetic observatories should be used in and above the auroral zone for
reliable determination of the extrapolated undisturbed level during the long
summer and other extended periods of activity.
The
models determined from ground-based magnetic observations are only the
so-called 'equivalent ionospheric currents' and need to be upgraded to the
physical current systems. Such currents
can be determined in association with ionospheric observations and models of
the D and E region plasma density and its associated conductances. By combining available ionosonde, riometer
and DMSP imagery and also POLAR auroral observations, basic synoptic models of
the E and D ionospheric regions and its conductances can be determined. The electric fields can then be estimated
using either of the methods developed by Faemark (1977), Kamide et al., (1981)
or Richmond (1992) with these ionospheric conductivity models and the equivalent
current determined from the magnetic observations. The Hall, Pedersen and field-aligned currents
and Joule heating can then be determined.
As some of these ionospheric data are also becoming available in
real-time, the models of the D and E region electrodynamics and some related
magnetospheric parameters could be made on a timely basis.
The
main purpose of this note is to discuss synoptic modeling of the northern D and
E region ionosphere from ionosonde, riometer and satellite observations. The determination of the Hall and Pedersen
conductivities can then be made and also the energetic particle precipitation
can be estimated. These parameters and
the equivalent currents determined from the magnetic observations can then be
used to determine the associated electrodynamics and the Joule and energetic
particle heating. Such modeling
techniques could be incorporated into the real-time (phase 2) and definitive
modeling procedures of the magnetic activity to provide a more accurate measure
of the geospace activity.
TIMELY MODELLING OF THE IONOSPHERIC D and E REGIONS
The
accurate modeling of the high latitude ionosphere is difficult because it is
generally always disturbed with both local and large scale undulations during
unsettled times and orders of magnitude changes during magnetic storms. Furthermore, all the ionospheric observing
techniques have significant limitations and the sparse distributions of
ground-based stations in the high latitude regions results in spatial aliasing
of localized disturbances. However,
Walker (1989), using spherical cap harmonic analysis (SCHA; Haines, 1985, 1988)
and data from the sparse Canadian observatory network, successfully
demonstrated the feasibility of modeling the large scale magnetic disturbances
by smoothing the data to reduce the spatial aliasing of short period but local
disturbances. Note the magnetic vector
observations provide 3 data points at each station while ionospheric
observations provide only one data point per station for modeling (SCHA) purposes. Hence at least twice as many ionospheric
observations are required for the same model resolution as for that determined
from magnetic data.
The
soundings from an ionosonde, the ionospheric absorption determined from a
riometer and the auroral brightness observations obtained by satellites based
observations could all be reduced to Chapman layers for the D and E regions and
combined for improved resolution of the ionosphere. A Chapman layer is defined with the peak
value and height of the density and the scale height of the layer. The peak E region electron density can be
calculated from these three independent Chapman models; combined and used in
SCHA to determine the spatial variations of the electron density over the
region. Hence, the number of observations
can be significantly increased by combining the data from the numerous riometer
stations (Ranta et al., 1994) with that from the ionosondes and the DMSP
imagery and POLAR auroral observations to reduce the spatial aliasing of such
single point observations. The models
determined from the DMSP and POLAR imagery can also be calculated at ionosonde,
riometer and IS radar sites and compared to check the different modeling
procedures.
Ionosonde
soundings of the lower ionosphere are available during quiet to moderately
disturbed conditions from about 20 stations in northern Europe and Russia and
from about 12 in North America and Greenland including 7 new (and inexpensive)
CADI ionosondes (Daniell et al., 1990).
Note such bottomside soundings are up to only the peak electron density
of the D, E and F2 regions. However,
there are perhaps 60 or more riometers in the northern region, which can be
used to supplement the ionosonde observations.
Modeling the D and E region ionosphere over a high latitude region from
several different platforms is complicated and requires the following steps.
1.
Scale the ionograms and convert the frequency for the E region to height
profiles of the electron density and also fit a Chapman layers to the lower
half of the layer (Walker and Bhatnagar, 1989).
Such modeling also provides a good estimate of the ubiquitous upper half
of the E region. However, during large
disturbances the ionosonde signals are scattered and another method is
necessary to estimate the E region electron density.
2. A
complement to the ionosonde during storm conditions is the riometer, which
measures the intensity of extraterrestrial HF waves traversing the
ionosphere. The absorption of these waves
is particularly sensitive to ionization in the D region which, in the auroral
zone, is closely related to the D and E region ionization and the auroral
brightness. Walker and Bhatnagar (1989)
related the absorption of these waves to Chapman layers for the D and E region
electron density. Their modeled height
profile for a 3 dB event agreed well with that independently determined by
Kirkwood and Collis (1987) from an average of several EISCAT IS observations of
3 dB events. See figure below which compares
the observations and the modeled height profiles of the electron density.
Determine
the absorption by subtracting the quiet day curve for each riometer station and
Gaussian smooth the data over the hour-long sample period. Next, determine the peak electron density and
its height from the Chapman relation developed by Walker and Bhatnagar, for
such reduced absorption periods. Note
the reduced riometer observations are relative to the quiet day and hence need
to be supplemented with a 'rest-absorption'. For remote sites the
rest-absorption can be estimated following the method of Friedrich and Torkar
(1995) for the appropriate quiet night (-O.03 dB) or day ionosphere which is
dependent on the solar zenith angle.
However, during unsettled conditions the height of the layer and also
its scale height can be adopted from those determined from nearby ionosonde
observations, as the E layer is generally similar throughout a region. Note the magnitude of the Chapman layer is
determined from the riometer observations.
Substorms
are the primary phenomena, which cause most of the problems in industrial
facilities and on satellites and are also the most perplexing disturbance in
the magnetosphere. Ionospheric
observations must be made at intervals typical of the scale size of moderate
substorms, which is, at most, several hundred kilometers.
The
DMSP imagery can indicate the extent and brightness of the aurora. It has a resolution of about 2.5 kilometers
at auroral altitudes and a swath of ~3000 km, and with 2 satellites in
dawn-dusk polar orbits at any one time, can provide a temporal resolution of
about 45 minutes. However, the times of
the passes are irregular and the period for the synoptic modeling should initially
be an hour but eventually be at half hour intervals or less to encompass the
dynamics of large substorms.
3.
First determine and subtract the background albedo from the DMSP images. Sample the DMSP auroral imagery at fixed
locations and moderate resolution for 4 or more consecutive passes and model
these data with SCHA using time terms to link up the observations. The dynamics of the aurora can be delineated
from such modeling and the position and brightness of the aurora can then be
calculated from the coefficients for the time dependent model at any time and
place between the first and last satellite pass used in the modeling. Note, unfortunately the DMSP-imagery is
presently unfiltered and the calibration step is unknown for some old satellites. However, these observations can be calibrated
during stable auroral emission periods with coincident observations from POLAR.
4. The
brightness of the aurora at the sampling intervals can be determined from the
time dependent auroral models and related to a Chapman layer from which the
peak electron density and its height can be inferred (Walker, 1972, Walker et
al., 1981 and Meng et al., 1986). The
POLAR UV auroral imagery compliments the DMSP observations and can also be used
to monitor the auroral activity in sunlight regions. The POESS particle data might also be used to
calculate the ionization rate from which an ionosphere can be estimated. The International Reference Ionosphere (IRI;
Bilitza, 1990) can be used in remote regions where there are no observations.
5. The
peak E region electron densities determined from the ionosonde data and that
modeled from the riometer and DMSP imagery and the POLAR auroral observations
can be combined and used to model (SCHA) the spatial variations of the density
and the scale height of the E layer. A
35 degree (half width) cap for the SCHA that is also centered on the eccentric
dipole provides a natural co-ordinate system for the modeling that also just
coincides with the region of observations.
By using SCHA for the modeling higher resolution can be obtained with
models of low order and degree and fewer coefficients and numerical problems as
the modeling region just fits that of the observations. A more dynamic and accurate E region can be
constructed by using the observed peak and scale height parameters from the
different platforms for the Chapman layer and SCHA. Hence reasonably sound synoptic models of the
E region could be constructed over the northern polar cap, auroral and
subauroral zones.
6. The
Chapman functions determined for the different regions (step 5) could be used
to calculate the height profiles of the electron density. Then with an appropriate model of the
atmosphere, the Hall and Pedersen conductivities can be determined. Plots of the contoured modeled peak density
along with the peak values of the observed electron density can be used to
check for inconsistencies in the observations and the modeling. Similarly plots of the contoured height
integrated Hall and Pedersen conductances can be used to check for
inconsistencies in the scale heights of the electron density. These models of the Hall and Pedersen
conductances are subsequently used in the solution of Poisson's equation for
determination of the electric field (KRM or other methods),
7. The
energetic particle precipitation and heating can be estimated from the POESS
data or from the auroral models. The
combined Joule and energetic particle heating can be used to infer the polar
thermospheric winds. Timely plots of the
aurora are of interest to those operating low altitude satellites and power
distribution systems as they indicate the location of the main activity and the
state of the magnetosphere.
8.
Reeves et al. (1998) have devised a method to infer the inner magnetosphere
temporal and spatial variations of the particle population from only a few
satellite observations. The energetic
particle precipitation determined from the E region models can be mapped into
the magnetosphere to extend these in situ observations and provide better
spatial and temporal resolution of the particle population. However, the relation between the ionospheric
models and the magnetosphere particle population should be frequently
'calibrated'. It is suggested that a
multibeam riometer, of at least 16 beams and possibly an ionosonde be located
at each of the conjugate points of the geosynchronous satellites so that a more
accurate relationship can be established between the different regimes. The E region electric fields can also be
mapped into the magnetosphere to infer the direction and magnitude of the
convection.
E REGION ELECTRODYNAMIC MODELLING and COUPLING
A
mid-winter storm might be selected for detailed study of the proposed modeling
techniques. The first step involves
determining the magnetic disturbances for the period from all available
observatories and selected variation stations in the northern region and
determination of the E region electrodynamics.
Walker has developed a procedure and facility for accurately modeling
magnetic disturbances and the associated equivalent ionospheric and induced
currents. It uses the quiet night-time undisturbed field for the reference
level (Walker, 1982); the Dst index to remove the symmetric part of the ring
current field from the observations; Gaussian smoothing of the data to reduce
the spatial aliasing of sparse observations and harmonic modeling. The harmonic modeling separates the induced
internal current sources from the external (ionospheric) sources. The modeling errors of the vector field range
from 5 nT during quiet times to ~80 nT during the peaks of major storms (Walker
et al., 1997).
The
next step involves modeling of the electric field using possibly the KRM, AMIE or possibly the new rtAMIE
method and the modeled conductances and the equivalent
ionospheric currents. These models
should be compared with those determined from the SuperDARN
radar observations. The Hall and
Pedersen ionospheric currents can be calculated from the conductances and
electric fields anywhere and at anytime for comparison with other observations
such as those from various types of auroral radars, imagers and
interferometers. The currents can also
be calculated along the footpath of satellite-based field, particle or imagery
observations. Plots of the current
vectors are useful for inferring the intensity, direction and spatial extent of
the current system (Walker and Papitashvili, 1994). Maps of such vectors are of interest for
studying the morphology and dynamics of the high latitude Sq, convection, storm
and polar cap current systems (Papitashvili et al., 1990). The ionospheric currents are also of interest
for investigating their coupling with the magnetosphere. The field-aligned currents can be estimated
from the divergence of the ionospheric currents.
The
field-aligned currents, the electric field and the particle flux can be mapped
along the earth's magnetic field to the magnetosphere and, with in situ L1 and
GOES observations, can be used to infer its status. Timely snapshot models (maps) of the
magnetosphere are essential for monitoring its activity and provide an
indication of the location of active regions for those operating geosynchronous
and other satellites. Finally, with
real-time L1 solar wind observations, these magnetospheric snapshots provide
the basis for inferring the short-term dynamics (now casting) of the
magnetospheric and related auroral, ionospheric and magnetic activity.
The
Joule heating can be calculated directly from the Pedersen conductivity and
electric fields. It is valuable for
monitoring the deposition of the energy of the storms and for comparison with
related phenomena in the magnetosphere, ionosphere and in the upper and middle
atmospheres. The upper atmospheric
temperatures and winds can be inferred from the heating and E fields and
compared with observations such as those by WINDII on UARS or on ODIN. The heating in the mesosphere appears to
disturb the polar vortex, which builds up each winter and links the middle
atmosphere with the polar troposphere.
It
would be valuable to have available "definitive" synoptic models of
the magnetic activity, the ionospheric electrodynamics and the induced currents
in order to investigate the effects of storms on the different commercial
facilities. The models could also be
used to correct magnetic surveys for temporal disturbances and for geospace
research such as those of the International CAWSES program. Walker et al. (1997)
have made such hourly models of the magnetic activity and the associated equivalent
ionospheric and induced currents for the whole northern region from data from
55 observatories for 1980 and for northern North America for 1989 (17544
models). These simple models have been
used to correct magnetic surveys for temporal disturbances (Newitt and Walker,
1990 and 1993), for investigation of induced currents in powerlines (Boteler,
1996) and for space research (Walker and Papitashvili, 1994).
References
Baker, D.N., S. Kanekal, J. B. Blake, B. Klecker and G. Rostoker,
Satellite anomalies linked to electron increase in the magnetosphere, EOS
Trans. AGU, 75, 410, 1994.
Bames, P.R. and J.W. Van Dyke, Economic consequences of geomagnetic
storms (a summary), IEEE power Engineering Review, Nov., 3, 1990.
Bilitza, D. International Reference Ionosphere 1990, URSI-COSPAR, Report
NSSDC/WDC-A-R&S 90-22, Greenbelt MD, 1990.
Boteler, D.H., Predicting geomagnetic disturbances on power systems,
Eos, Transactions, Amer. Geophys. Union, 72, 14, 159, 1991.
Boteler, D.N., Telluric current effects on pipelines, Presented at
International Conference on Pipeline Reliability, Calgary, June 2-5, 1992.
Boteler, D.N. and B. St. Louis, Monitoring and study of the magnetic and
electric fields occurring in Quebec during geomagnetic storms, Hydro-Quebec and
Geological Survey of Canada Joint Project, 1996.
Callis, L.B. and M. Natarajan, The Antarctic ozone minimum: relationship
to odd nitrogen, odd chlorine, the final warming and the 11-year solar cycle,
J. Geophys. Res., 91, 771, 1986.
Daniell, R.E., L.D. Brown, W.G. Whartenby, D.N. Anderson, J-A. Whalen,
J.J. Sojka and R.W. Schunk, A high latitude ionospheric specification model
(HLISM), in Solar-Terrestrial Predictions: Proceedings of a workshop at Leura,
Australia Oct, 1989, NOAA/ERL, Boulder, CO, USA, 1990.
Faermark, D. S., A restoration of 3-dimensional current systems in high
latitudes by the use of ground-based magnetic observations, Geomag. Aeron. 17,
163, 1977.
Friedrich, M and K.M. Torkar, Typical behavior of the high latitude lower
ionosphere, Adv. Space Res., 16, 1 73, 1995.
Haines, G.V., Spherical cap harmonic analysis, J. Geophys. Res., 90, B3,
2583, 1985.
Haines, G.V., Computer programs for spherical cap harmonic analysis of
potential and general fields, Computers and Geosciences, 14, No. 4, 413, 1988.
Kamide, Y., A. D. Richmond and S. Matsushita, Estimation of the
ionospheric electric fields, ionospheric currents, and field-aligned currents
from ground magnetic records, J. Geophys. Res. 86, 801, 1981.
Kirkwood, S. and P.N. Collis, The high-latitude lower ionosphere
observed by EISCAT, Adv. Space Res., 7,83, 1987.
Lam, H.-L. and J. Hruska, Magnetic signatures for satellite anomalies,
J. Spacecraft and Rockets, 28, 1, 93, 1991.
Meng, C.I., R.E. Hoffhlan, R.A. Skrivanck, D.J. Stficlan and R.E.
Daniell, Jr., Remote sensing of the ionosphere using ultraviolet and visible
emissions, Soc. Photo Opt. Instrum. Eng., 687,62,1986.
Newitt, L.R. and J.K. Walker, Removing magnetic activity from high
latitude repeat station observations, J. Geomag. Geoel., 42, 93 7, 1990.
Newitt, L.R. and J.K. Walker, Correcting magnetic repeat station data
with models of the field variations, IAGA, Buenos Aires, 1993.
Papitashvili, V.0., Ya.l. Feldstein, A.E. Levitin, B.A. Belov, L.I.
Gromova and T.E. Valchuk, Equivalent ionospheric currents above Antarctica
during the austral summer, Antarctic Sci., 2 (3), 267, 1990.
Ranta, H., A. Ranta, P. Stauning, Z.Ts. Rapport, V.M. Sinelnikov, S.
Kirkwood, J. Lastovicka and A.K. Knyazev, Morphology of the D and E-region at
high latitudes in the northern hemisphere during the DYANA campaign in 1990, J.
Atmos. Terr. Phys., 56, 1933-1945, 1994.
Reeves, G., R. Friedel and R. Hayes, Maps could provide space weather
forecasts for the inner magnetosphere, EOS, 79, 50, Dec. 15 1998.
Richmond, A. D. Assimilative mapping of ionospheric electrodynamics,
Adv. Space Res., 12, 6(59), 1992.
Wadham P.N., The effects of electrostatic discharge phenomena on
Telsat's domestic communications satellites, AGARD-CP-406, p25,1987.
Walker, J.K., Auroral ionosphere models, J. Atmosph. Terr. Phys., 34,
1681, 1972.
Walker, J.K., Extremely quiet night-time currents and magnetic baselines
at Canadian observatories for the separation of external and internal fields,
J. Geophys. Res., 87, A9, 7525, 1982.
Walker, J.K., Spherical cap harmonic modelling of high latitude magnetic
activity and equivalent sources with sparse observations, J. Atmosph. Terr.
Phys., 51, 2, 67, 1989.
Walker, J.K., J.A. Koehler, F. Creutzberg, A.G. McNamara, A. Valiance
Jones and B.A. Whalen, Poststorm convection and auroral arc currents determined
from multiple ionospheric, magnetic and electric field observations, J. Geophy.
Res., 86, 9975, 1981.
Walker, J.K. and V. Bhatnagar, Ionospheric absorption, typical
ionization, conductivity and possible synoptic heating parameters in the upper
atmosphere, J. Geophys. Res., 94, A4, 3713, 1989.
Walker, J.K. and V.0. Papitashvili, Models of polar geomagnetic activity
and equivalent currents: approach and comparison of techniques, STEP Columbia
Proceedings 1992, Planet. Space Sci., 1994.
Walker, J.K., V. Semenov and T.L. Hansen, Synoptic models of high
latitude magnetic activity and equivalent ionospheric and induced currents, J.
Atmosph. Sol. Terr. Phys., Vol 59, No 12, pp 1435-1452, 1997.
This plan involves modest expansion of some resources so please drop me
a note, thanks.